Warning: This post is multiple years out of date. The content is left up for reference and keeping links valid, but there is likely better, more up to date content available.
Browsing through the daily news sources, I came across this interesting inequality, discovered by Jeff Tupper:
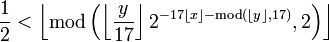
Formula
Well, what's so good about it? After all, it's just an inequality, right? It's not just any inequality though. Try plotting it. More specifically, Let k be the following number:
96093937991895888497167296212785275471500433966012930665150551927170280
23952664246896428421743507181212671537827706233559932372808741443078913
25963941337723487857735749823926629715517173716995165232890538221612403
23885586618401323558513604882869333790249145422928866708109618449609170
51834540678277315517054053816273809676025656250169814820834187831638491
15590225610003652351370343874461848378737238198224849863465033159410054
97470059313833922649724946175154572836670236974546101465599793379853748
3143786841806593422227898388722980000748404719
Then plot the inequality over the set of points with x varying from 0 <= x <= 106 and k <= y <= k+17
Here's the result (do prepare to have your mind blown):
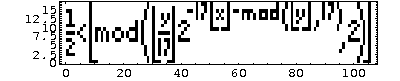
Formula Plot
Sure looks like the actual inequality, doesn't it? If you don't believe me, you can try it out yourself. (it doesn't seem to work in Chrome, though)
Sources: Wikipedia
- Hasnain
PS: Maybe this posting style would be better and more interesting, let's see how it goes.