After the recent launch of my new side project, trackmy.games (which you should totally try out!); I was looking for an easy monitoring solution to see how my code was performing. Having monitoring is important - even though this is a side project, I want to know when things are breaking so that I can fix them - a bad user experience sticks, and when trying to get new users you want them to have delightful experiences.
I’m still pretty new to open-source monitoring tools - my previous experience was at $BIGCO where we had custom homegrown tools for monitoring that worked pretty great (you can learn more about them here). I looked for equivalents out there, and saw a ton: Grafana+Prometheus, Datadog, NewRelic, Honeycomb (the list goes on...) - but they all had the same problem: they were a lot of work to set up and I was lazy.
Zooming back out for perspective, I had to remind myself that this was a side project and my time was limited. I wasn't being paid to work on this and find the perfect solution. My goal here was to quickly get something that meets my needs so that I could spend my time on what's most important: building out features and delivering value for my users. That ruled out most of the solutions listed earlier - I couldn't invest in the one-time setup needed to get started (I have a lot of things to build) or pay the ongoing maintenance cost of adding more logs as I build out new features. This is all independent of monetary cost (I've set up grafana+prometheus for free for other things - it's still a big time sink even if it's free). So I was stuck.
Aside: I've found a good read on this phenomenon - in this context, I'm a 99% developer as per this article: "These are developers who are getting work done outside of the hip companies and frameworks, who often get neglected in conversations about “what developers want.” There’s a huge gap between what “developer-influencers” are talking about, and the daily reality of most developers."
So I went back to the drawing board. And remembered I'd heard of Akita - a drop-in monitoring tool for APIs. I've known the team for a few years and have been excitedly following the product for a while (standard disclaimer: I'm not affiliated with them and received no compensation for the post - I'm just a fan). While I'd mostly thought of it for APIs, I thought to myself: maybe it'll work for a site too? I signed up for the private beta and tried it out. And it worked really well, so here I am blogging about it. I'll probably use this going forward for other projects and would recommend it for professional usage where applicable.
Getting started
Getting started was surprisingly easy. I'm using docker-compose, so I followed the docs and got it up and running in under 5 minutes, just like the home page said! That included time debugging why it didn't work initially (my bad: the documentation spelled out I need version 3, but my compose file was version 2. Changing that fixed the issue).
Viewing the data
Once I was set up, I went through the UI to see what it had learned. Note that the new user experience has a slightly less information (it takes a bit of traffic to learn more about the system, though it was surprisingly useful with even a few minutes of data and ~10s of requests). Accordingly, the screenshots and data below are from about a week's worth of data (taken at the time of this writing).
Overview
Once you log in, you have a nice dashboard that shows how things are going at a quick glance:
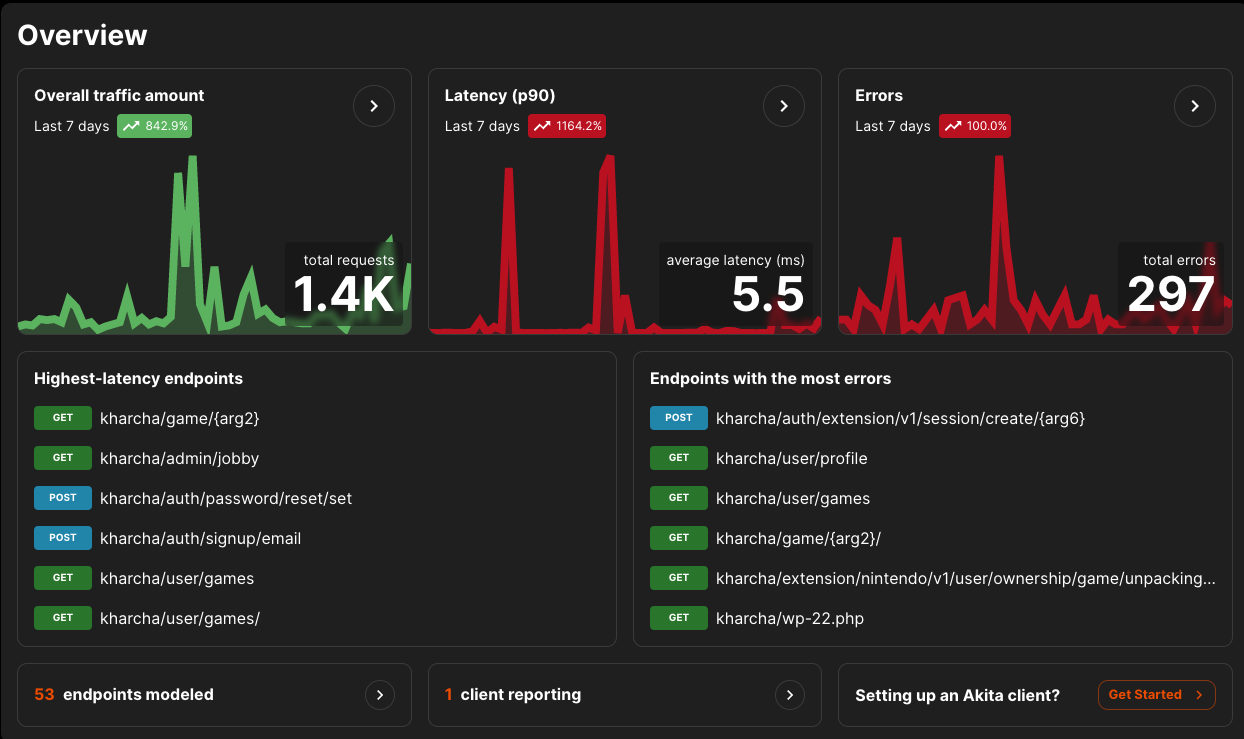
The overview page. You can see everything at a glance
I really liked this as I could easily see if I had a spike in latency, errors, or requests, and fix things accordingly. Clicking through on those charts brings you to the metrics & errors page.
Metrics & Errors
If you saw the above page and wanted to see more detail, well, this is where you can see it. At a glance, you can see requests over time, duration, and error rates. There's a huge table of endpoints below (trimmed for the screenshot) and you can filter to your heart's content to see if any problems exist.
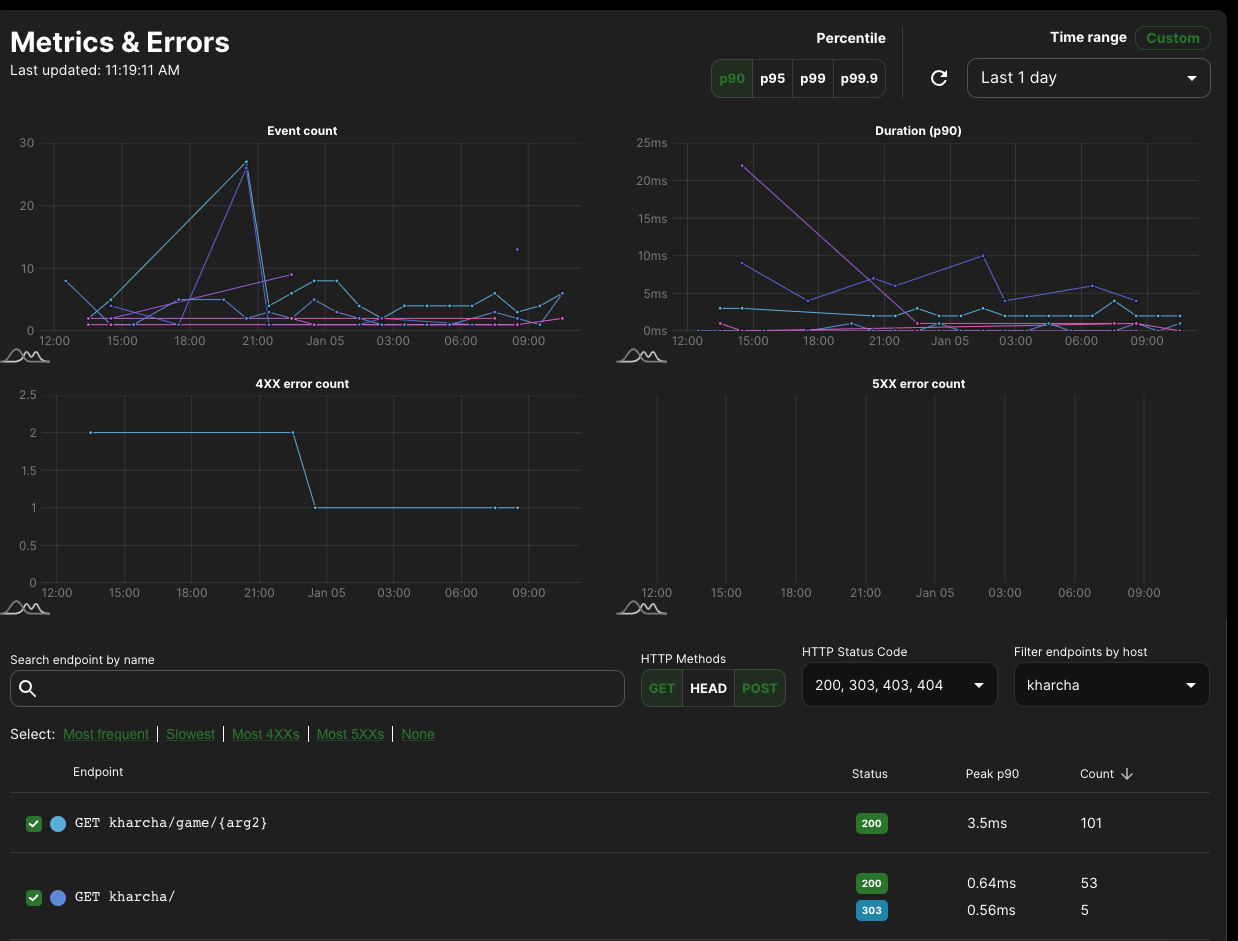
The metrics and errors page. Full of data
API Models
One of the most powerful things about Akita is its API modeling technology which infers which APIs you have and how they are structured - it powers how they group requests in the UI, among other things. I really found it useful for documenting my APIs for future-me when I forget how something is structured or want to send some requests from the client. You can see a pretty description of the endpoint on the UI or via the OpenAPI spec that it infers. I've included a spec definition (was too big to screenshot) below for one of the endpoints of my backend API:
/extension/steam/v1/user/ownership/app/{arg7}:
    get:
      operationId: GET /extension/steam/v1/user/ownership/app/{arg7}
      parameters:
      - in: header
        name: X-Csrf-Token
        schema:
          type: string
      - examples:
          "1378990":
            value: "1378990"
          "1382190":
            value: "1382190"
        in: path
        name: arg7
        schema:
          format: int64
          type: integer
      responses:
        "200":
          content:
            application/json:
              schema:
                properties:
                  other:
                    items:
                      properties:
                        is_digital:
                          type: boolean
                        is_physical:
                          type: boolean
                        link:
                          type: string
                          x-akita-format:
                            formats:
                            - url
                            kind: uri
                        source:
                          type: string
                      type: object
                    type: array
                  primary:
                    type: string
                    x-akita-info: Akita only saw null for this field, so we picked
                      type `nullable string` for it by default.
                  same:
                    items:
                      type: string
                      x-akita-info: Akita only saw empty lists for this field, so
                        we picked type `string` for the list elements by default.
                    type: array
                type: object
          description: 200 response
          headers:
            Permissions-Policy:
              schema:
                type: string
            Server:
              schema:
                type: string
      security:
      - bearer: []
There's a lot to take in here, so I'll call out some highlights:
- Akita learned that the client always sends CSRF tokens here (... I should fix that, it always sends the tokens even when not needed on GETs)
- It learned that the argument is always an integer (in this case a steam appid)
- It correctly deduced the structure of the response as a JSON dictionary with a list of items, each with an identifier, a URL, and a few booleans
- It inferred that this request needs authentication (the
securitysection has abearertoken).
Case studies
If that's all I got out of Akita, I would say it's a cool tech demo but maybe not fully worth it. However, I was able to use it to ship product improvements within just a few days - I'd call that totally worth it. This section goes into two examples where it delivered a lot of value for me:
Search latency improvement
Looking at the latency numbers a few days in, I saw that the average latency was higher than my target. With a few clicks, I was able to find the offending endpoint: the game info page. The endpoint details page on Akita showed this:
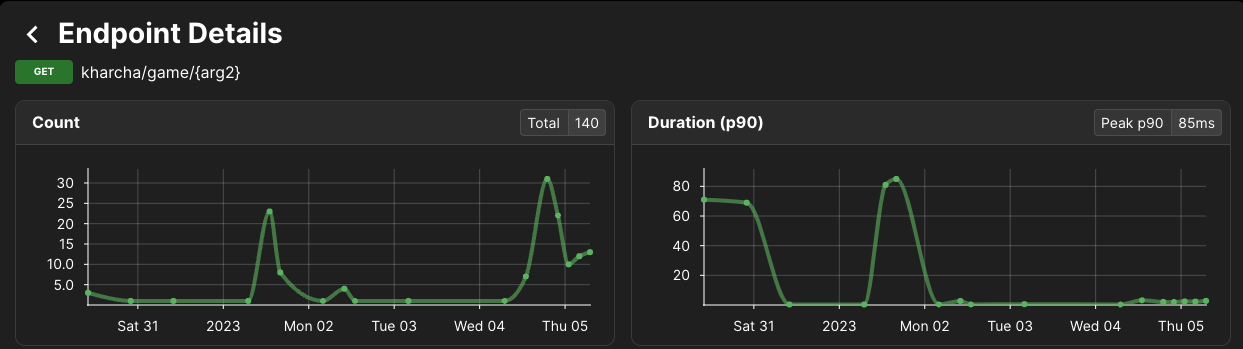
Latency for this endpoint was high until Mon 02
Latency was consistently 70-80ms, which was too high for my liking. I was able to easily reproduce this in my dev environment, trace the database accesses (I had to do this manually) to identify a slow query that wasn't indexed and pushed out a new build after that with a fix. You can see the latency drop to acceptable levels after that change, even with more requests coming in.
Fixing user-reported errors
A kind beta tester (thank you!) pointed out they were having issues authenticating to the site. I wasn't sure what was going on, and given the custom authentication schemes going on (and the timezone differences) I wanted to debug it myself before asking for more detail.
Akita was super helpful here - I could quickly see which endpoints were throwing errors around the time of the bug report - here's an example screenshot (not of the specific bug, unfortunately - that was too small a spike to easily show on a graph):
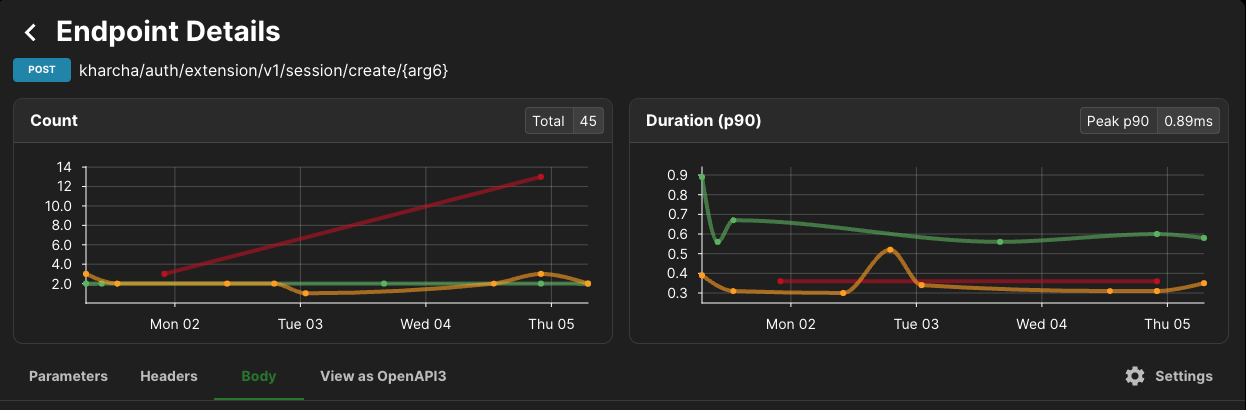
Seeing errors for a given endpoint. The green line is HTTP status code 200, orange is 403, red is 500.
From there it was fairly straightforward to identify the flow he'd taken (using the endpoint name) and reproduce the bug myself - and I was able to roll out a fix in a few minutes and just tell them it was fixed and they could try again.
Conclusion
If you're looking for a dead simple monitoring tool that lets you see how your site/API is doing at a glance and identify things you should fix, I highly recommend trying Akita. I'd especially recommend it if any of the following describes you:
- You're new to the monitoring/observability space
- You want to get something working quickly so you can get back to delivering user value
- You want a solution that doesn't require changing any of your service code or maintenance cost
This has been a more technical piece than usual - as always, please let me know if you found this interesting, if you'd like more of this type of content, or if you have any feedback in general!